As an Account Admin, you can generate usage reports and check who has been accessing the various projects in your various subscriptions.
If you have several subscriptions (or plans), select one of them first.
Go to your ‘Administration’ tab and select ‘SUBSCRIPTIONS’. On the left, select the plan that you wish to analyze.

Generate a usage report for the selected plan.
For the selected plan, click on ‘Generate Usage Report’ on the right.

This will prompt a pop-up window, asking to select the period:
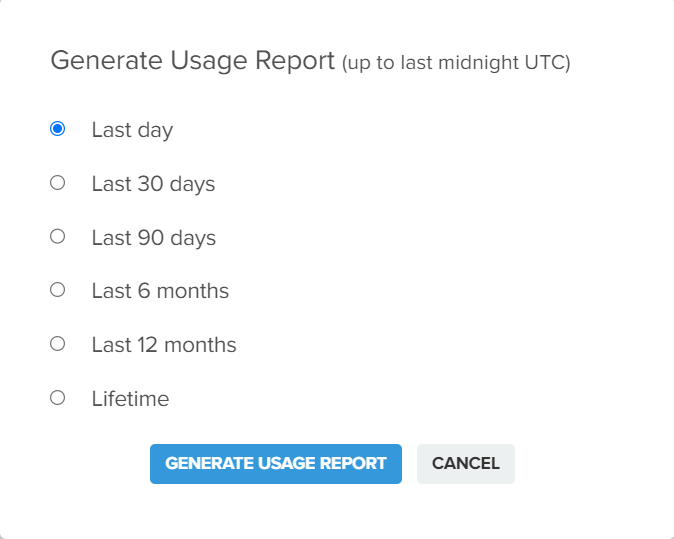
UTC means ‘Universal Time Coordinated’. Midnight UTC equals:
- 1:00 am UK
- 2:00 am France
- 9:30 am ACST (Australia Central Standard Time)
- 8:00 pm EST USA (previous day)
- 5:00 pm PST USA (previous day)
Clicking on ‘GENERATE USAGE REPORT’ will create a CSV file that will be downloaded from Cintoo Cloud.

Using Excel, you can select all the columns and click on ‘Filter’ in the ‘Data’ tab:
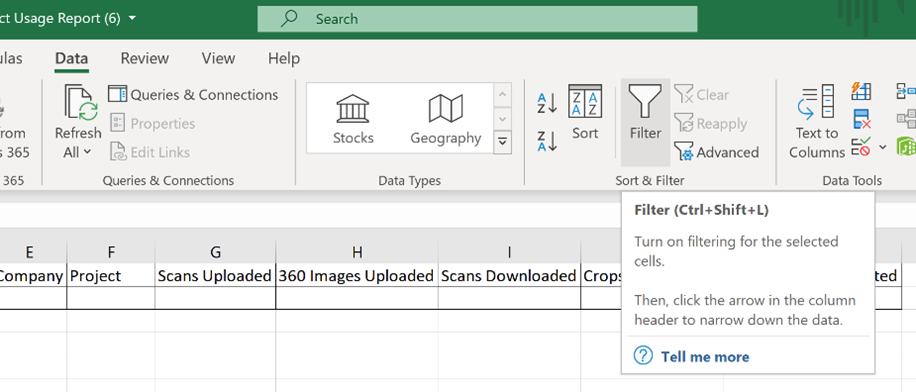
You can then sort your list per each column very easily:

Understanding the Usage Report.
- First name, last name, email company: Users who have accessed a project at least once during that day.
- Note: Users who have accessed a project using a Shared View will be counted if they were logged in to Cintoo Cloud while they accessed this Shared View.
- Scans uploaded: Showcases the number of scans downloaded into projects within this Cintoo account.
- 360 Images uploaded: Displays the number of 360 images uploaded through the Cintoo 360 image uploader. This does not include 360 images embedded in scan data.
- Scans downloaded: This column counts the number of scans selected in the Data tab when the user clicks on the ‘Export Scans’ button (if the selection englobes work zones, all scans in the work zones will be included) and also the number of times the user clicks on the scan download button. It also means that:
- Downloading the same scan multiple times will count as multiple scan downloads, not just once.
- Also, if the scan files are not successfully downloaded for whatever reason, it will still count in the report:
- Problem with Cintoo Connect
- Download suspended because the user has closed Cintoo Connect
- Download not started since the user did not click on ‘Export’ in Cintoo Connect
- Crops downloaded: This column counts the number of times the user clicked on the ‘Export’ button in the crop tool in either the Overview Map or the 3D View, whether the crop export was successful or not.
- Unified mesh creation: This column counts the number of times the user clicked on ‘Create Mesh’, whether this unification process was successful or not.
- Tags uploaded: This column shows how many asset tags have been uploaded at each instance.
- Tags downloaded: This column shows how many asset tags have been exported from the Cintoo account.
The report includes specific columns for import and export operations, but operations such as 3D visualization are not highlighted. Therefore, you may see users with zero import/export operations listed on the report, indicating that they have accessed the project for other purposes. The report lists each project per user and per day, and if a user has accessed the same project multiple times in one day, only one entry is added for that user and project on that date. If a user has accessed multiple projects in one day, there will be one entry per project for that user on that date. If a user has visited a particular project for five consecutive days, the project will be listed five times for that user, each with a different date.
Was this article helpful?
That’s Great!
Thank you for your feedback
Sorry! We couldn't be helpful
Thank you for your feedback
Feedback sent
We appreciate your effort and will try to fix the article